What should we make of cuts and changes to official statistics?
This is lightly adapted from a blog post for the LSE policy and politics blog, which also appeared on the RSS’s website Stats Life
Collecting, analysing and (sometimes) disseminating statistical data are typical activities of modern states. In liberal democratic countries, at least, statistics are used inside and outside government to investigate and debate the whole spectrum of social problems: the economy, population, environment, employment, welfare, health and so forth. Thus when governments undertake, on grounds of purported necessity, to reduce expenditure, or on grounds of principle, to “shrink the state”, official statistics are not exempted from the axe. Deciding which statistics might be superfluous or burdensome involves debates about what official statistics should be measuring: what are truly “social problems” with which the state should concern itself. It is also a matter of why and for whom official statistics are prepared: for government’s internal use, for the public sphere, for businesses, for researchers, and so on.
Statistical Cuts under the Coalition Government
The first couple of years of the coalition saw a large numbers of announcements and consultations about cancellations and reductions in official statistics. These were sufficient to arouse the ongoing interest of the UK Statistics Authority, the independent body established by the Statistics and Registration Service Act 2007 to oversee UK statistics. Radical Statistics (whose conference is on 8 March) also started monitoring and reporting on the nature, scale and implications of cuts to government statistics. Set against these reductions, there is a proclaimed commitment to “open data”, with David Cameron promising in 2010 that this would be “one of the most transparent governments in the world”. Now, nearly four years into the coalition, an interesting picture of “austerity statistics” is emerging, one unlike that of retrenchment at the start of the 1980s, and one which suggests how central data have become in the management of part-privatised policy domains.
Types of Statistical Cuts
The cuts since 2010 are of several different kinds. Relatively large savings have been made by the wholesale cancellation of specialised data collection exercises, such as DCLG’s Citizenship Survey and Place Survey. Some are more lamented than others: the Citizenship Survey was a well regarded, established, and unique enquiry into community engagement and relations, whereas the Place Survey had few defenders. Smaller savings have been made by reducing the scope of data collection, such as cutting the sample size of the Family Resources Survey, the premier source on household income and poverty. Such cuts retain the value of continuous series and datasets, but reduce the accuracy and flexibility of analysis on these themes. Lastly, minor savings can be made by discontinuing or reducing statistical publications that are, or are argued to be, redundant, little-used or superseded.
Unsurprisingly, the pattern of cuts tends to reflect the preoccupations of the government. Since the government is ambivalent about whether policy should pursue the reduction of poverty as it is conceived and measured in the Family Resources Survey – relative to median income – it follows that it is willing to tolerate more uncertainty in such poverty measurement. This applies also to codings and categories used in data. DCLG has ceased including regional summaries in its publications on, for example, housing, because the Secretary of State does not see the statistical regions (“South East”, “North West” etc.) as proper and valid objects of policy-making. Given the pervasive use of these regions across official data, and the tiny savings to be had, it is hard to see this particular cut as other than statistical vandalism.
The Overall Scale of Cuts
Individual cuts matter a great deal for those involved in that field of policy. They don’t, however, give a picture of the statistical system as a whole. Are the cuts of a similar scale as in the early 1980s, following Derek Rayner’s review of official statistics which recommended a narrow focus on the needs of government? This pruned back the growth of government statistics in the 1970s, but by the mid-1980s serious problems with national accounting emerged, with effects on economic policy-making. One indicator we have now is the size of the Government Statistical Group – the number of professional statisticians in the civil service. The chart below shows figures from 2001 to 2013.
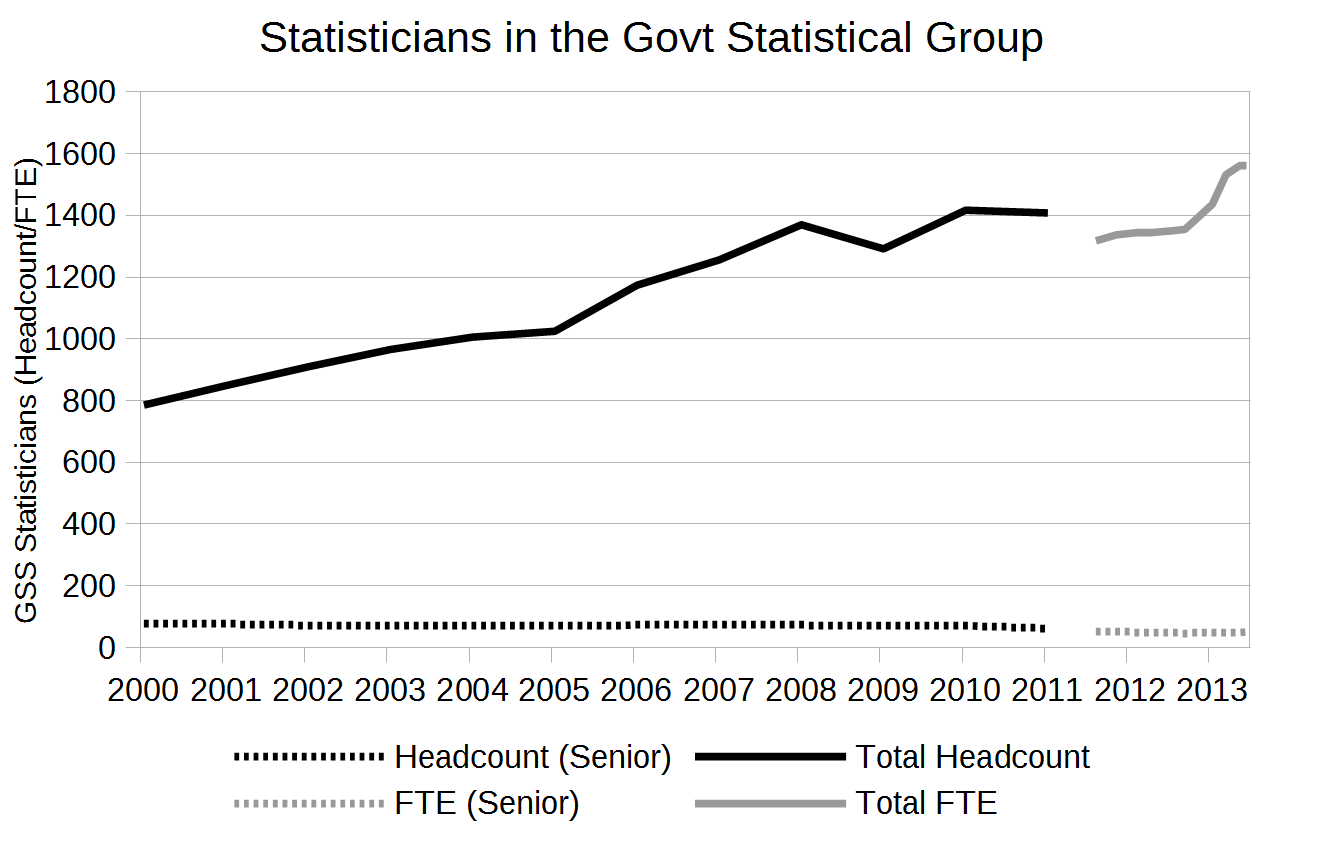
Figures compiled from the appendices of the minutes of the Committee for Official Statistics 2012-2014.
Interpreting the cuts
One striking feature is the very considerable growth of the statistical service under New Labour. In 2000, it was not that much larger than, say, in 1979, when there 540 statistical officials in central government; by 2011 it had nearly doubled. The 2000s were, like the 1970s, a period of expansion in official statistics. Equally interesting, the number of statisticians has continued to rise under the coalition (the break in 2011 is a change from headcount to full-time equivalent units).
There are several possible explanations. For one, a high proportion of statistical enquiries and products are required by UK or EU law. It may also be that systems of scrutiny and consultation have improved, protecting series that are genuinely valued. Certainly, one continuity between New Labour and the Coalition is that statistical data are deeply integrated into the management of part-privatised social policy domains. Transactional data – such as welfare claims or school results – are essential elements in creating and regulating markets in education, welfare and health, such as with the Work Programme, Academies and Free Schools, or for-profit provision in the NHS. When the state contracts out, such administrative data cannot be dispensed with. Recent developments leave questions open. What state are statistical services in outside central government, especially in local government, where funding cuts have gone deep? Is there a permanent shift from specialised forms of data collection designed by experts, such as sample surveys, to “big” and “open” transactional data? Who will do authoritative analysis of these data, and what then is the role of traditional statistical and social-scientific expertise? One pressing decision to watch is that on the future of the UK Census, which faces radical change to an as-yet untested alternative.
Acknowledgements
The initial idea and research on statistical cuts was carried out in early 2012 by a working group from Radical Statistics. I wrote it up further and updated the staff number analysis from UKSA papers.